Contributors

Dr. Chirag Shah - Rutgers University
Associate Professor of Information Science
Affiliate member of Computer Science
Kevin Albertson - Rutgers University
Master’s student - Computer Science and Mathematics
Introduction
An armed conflict is defined as a contested incompatibility which concerns government and/or territory where the use of armed force between two parties, of which at least one is the government of a state, results in at least 25 battle-related deaths (Wallensteen, & Sollenberg, 2001). With this proposed study the researcher aims to provide the academic community with the most comprehensive structured event data available on organized violence in the post-1989 world involving, and finally to provide some predictions about conflict dynamics of the locations and the effects of armed violence, in the form of deaths. Since middle-east is the current hot zone, where every day numerous people are losing their lives due to armed conflicts involving governments, sectarian groups, rebels etc., the researcher has decided to contain this proposed study involving only middle-eastern countries.
Literature Review
In the World Commission on Environment and Development (1987), Brundtland has summarized a common view of armed conflict as: Nations have often fought to assert or resist control over war materials, energy supplies, land, river basins, sea passages and other key environmental resources. Similar view of tussle over control of natural resources as the primary reason behind conflicts has been echoed in many other scholars’ work. Thus, Renner et al. (1991) claimed that “throughout human history, but particularly since the system of sovereign nation states, struggles over access to and control over natural resources … have been a root cause of tension and conflict” and that “history provides numerous examples of how states and nations were destabilized by environmental collapse leading to famine, migration, and rebellion.” Similarly citing the example of Pacific war (1879-84) between Chile and Peru over guano deposits, Brock (1991) asserted that “control over natural resources has always been important in enabling a country to wage war.”
In the early 1970s, there was an emergence of environmental issues on the international political agenda, since then there has been increasing concern that environmental disruption is likely to increase the number of disputes originating from competition for scarce resources (Gleditsch, 1998). This view was echoed in the speech of previous Norwegian Defense Minister Johan Jørgen Holst (1989) when he cautioned the world that environmental stress was likely to become an increasingly potent contributing factor to major conflicts between nations. Similarly, the then Secretary General of the Habitat conference in 1996 told participants that “the scarcity of water is replacing oil as a flashpoint for conflict between nations” (Lonergan, 1997). More recent variety of territorial conflict concerns the economic zone, a matter of dispute between most countries which are at the close vicinity of the sea and where tiny islands can sometimes become monumental national interest because of their consequences for controlling the shipping lane at sea. Thus, there are no less than six claimants to all or part of the Spratly Islands in the South China Sea (Denoon & Brams, 1997), where the use of force anytime cannot be ruled out.
As the above literature review suggest, all these previous studies has addressed conflict as the outcome variable and focused on identification of the primary factors behind the conflicts. However, one of the significant drawback in this line of work is that the duration of the conflict is not taken into account. Essentially, these studies do not differentiate between prolonged conflicts between nations (e.g., Iraq-Iran war, 1980-1988) and lone-wolf terror attack (e.g., Toulouse terror attack, 2012). To overcome this, the present study proposes to consider the duration of the conflict as the primary outcome variable and hopes to identify if the geographical location is a contributing factor behind the duration of the conflict.
Dataset
The dataset used for this study is Uppsala Conflict Data Program Georeferenced Event Data (UCDP GED) version 5.0 (Croicu, & Sundberg, 2016). The UCDP GED dataset is manually curated and compiled, with automatic assistance in data retrieval, filtering, data storage, and manipulation, as well as data validation. All the entries in the dataset are collected from three sets of sources:
- global newswire reporting.
- global monitoring and translation of local news performed by the BBC.
- the secondary sources such as local media, NGO and IGO reports, field reports, books, etc.
The basic unit of analysis in the UCDP GED dataset is the “event”, an individual incident or phenomenon of lethal violence occurring at a given time and place. More specifically Croicu et al. defined an event as:
"An incident where armed force was used by an organised actor against another organized actor, or against civilians, resulting in at least 1 direct death at a specific location and a specific date (p-2)."
Only events linkable to a UCDP/Peace Research Institute Oslo (PRIO) Armed Conflict, or a UCDP Non-State Conflict or a UCDP One-Sided Violence instance are included in this dataset. Events are included for the entire period, i.e. both for the years when such conflicts were active and for the years when such conflicts where not active.
The maximum (best) spatial resolution of the UCDP GED dataset is the individual village or town. The dataset is fully geocoded meaning, the coordinates of the places for each event, with its longitude and latitude values are available in the dataset. The maximum (best) temporal resolution of the dataset is the day. The UCDP GED version 5.0 dataset contains 1,28,264 events. It is a global dataset that covers occurrences of events in the entire Globe (excluding Syria) between 1st January 1989 and 31st December 2015. However, for this study, since we are focusing only on Middle East countries, we have taken only a subset of the UCDP GED dataset consisting events from Middle East countries only. Some of the fields which were deemed to be unnecessary/redundant for this study were also removed from the UCDP dataset. As result, the final dataset used for this study consists of 16646 events. Below is a quick overview of variables that are included as part of the dataset used in this study.
a) Relid: A quick machine parse-able string key describing the content of each event. The key is constructed using the abbreviation of the country name (for instance AFG for Afghanistan), the calendar year, the type of violence, the dyad or actor ID and a counter. This variable is also a unique identifier for each event in the entire dataset.
b) Year: The year of the occurrence for the event.
c) Where_coordinates: Name of the location to which the event is assigned. Fully standardized and normalized.
d) Latitude: Latitude (in decimal degrees).
e) Longitude: Longitude of the place (in decimal degrees).
f) Country: Name of the country in which the event takes place.
g) Date_start: The earliest possible date when the event has taken place (in YYYY-MM-DD format).
h) Date_end: The last possible date when the event has taken place (in YYYY-MM-DD format).
i) High_est: The highest reliable estimate of total fatalities. Since we are concentrating on the duration of the conflicts for these study, we have introduced one of our own variable, called Duration apart from those earlier mentioned, which represents the duration of a conflict in number of days. The Duration is calculated as:
<p ALIGN=MIDDLE>Duration: (Date_end - Date_start) +1</p>
So, from the above equation, the minimum duration of each conflict is one day.
Analysis
To analyze the data, we will start with some descriptive statistics of the data. As, the boxplot in the next page suggests (Fig. 1) that among all the middle eastern countries Egypt faced conflicts for longest span of time, whereas countries such as Bahrain, Qatar, and United Arab Emirates faced conflicts for shortest period of time.
| Country | Frequency of Conflicts | |
| 1 | Bahrain | 24 |
| 2 | Egypt | 536 |
| 3 | Iran | 219 |
| 4 | Iraq | 5891 |
| 5 | Israel | 2724 |
| 6 | Jordan | 2 |
| 7 | Kuwait | 40 |
| 8 | Lebanon | 1070 |
| 9 | Qatar | 1 |
| 10 | Saudi Arabia | 107 |
| 11 | Turkey | 4581 |
| 12 | United Arab Emirates | 1 |
| 13 | Yemen (North Yemen) | 1450 |
Table 1: List of countries and their frequency of conflicts
Also if we list the countries according to the frequency of violence faced in this time period, the result (Table 1) shows countries such as Iraq and Turkey are the most frequent to such conflicts, whereas Qatar and United Arab Emirates have faced least amount of conflicts.
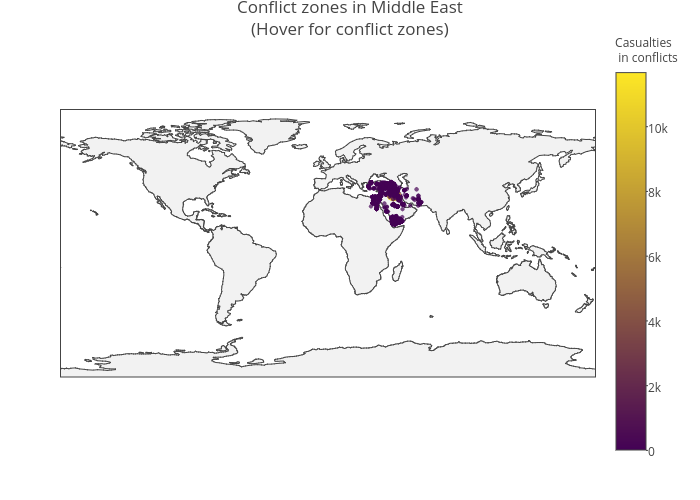
The basic intuition from the statistics should be, the places which saw largest number of violence and for longest period of time should count largest number of casualties. However, if we plot the co-ordinates (longitude and latitude) of each conflict area against the number of estimated deaths (Fig. 2), the map suggests apart from countries which are more prone to conflicts (such as Iraq) some of the other countries (such as Kuwait) with less number of conflicts also faced large number of casualties.
For this project, we are interested in the hypothetical relation between the duration of conflicts (the number of days one conflict lasts) and the countries as well as the relation between the number of casualties and the countries. So, the research questions we intend to find out are:
- RQ1: Are some of the countries in middle-east more prone to long term conflicts than short-term skirmishes, and
- RQ2: Are some of the middle-east countries are more prone to high casualty conflicts than other countries of the region?
So, the corresponding null hypothesis for the above two relations are respectively:
- H1: There is no significant difference between the countries on number of days each conflict lasts in each individual country.
- H2: There is no significant difference between the countries on number of casualties suffered in conflicts.
So, for this research design, the Duration and High_est are our outcome variables (DVs) whereas the Country is our independent variables (IV). Since we have more than one DV in this case, we will perform a multivariate analysis of variance (MANOVA) to test the significance of IV on predicting the DVs.
Results
We have tested the DVs to check for normality of the distribution. Unless the data is artificially generated by a particular, known distribution, it is often found that any reasonably effective distribution test will reject them. Nevertheless, it can be meaningful to use a goodness of fit statistic, like the KS statistic, to measure the deviation between the distribution of the data and any ideal distribution. Since the sample size of this dataset is larger than what Shapiro-Wilk test can handle (>5000), we have performed the two-sample Kolmogorov-Smirnov test, the result of which on both DVs are presented below:
For High_est:
Two-sample Kolmogorov-Smirnov test
data: high_est and m
D = 0.82891, p-value = 0.4979
alternative hypothesis: two-sided
For Duration:
Two-sample Kolmogorov-Smirnov test
data: duration and m
D = 0.95362, p-value = 0.3231
alternative hypothesis: two-sided
Fig 3: Two-sample Kolmogorov-Smirnov test result on both DVs
As, we can see in case of both DVs, the test statistics (p-value) is found to be non-significant, i.e., for both the DVs we fail to reject the null hypothesis which says the distribution of values for each DV is normal. Next, we check for homogeneity of variance-covariance matrices. Homogeneity of variance-covariance is the multivariate version of the univariate assumption of homogeneity of variance and the bivariate assumption of homoscedasticity. In short, homogeneity of variance-covariance matrices concerns the variance-covariance matrices of the multiple dependent measures (two in this case) for each group. For example, for two dependent variables, it tests for two correlations and four covariances for equality across the groups. The result of testing this assumption is shown below:
---------------------------------------------
armed4$country: Bahrain
         high_est duration
high_est 0.7173913 0
duration 0.0000000 0

armed4$country: Egypt
          high_est duration
high_est 188.582421 6.122154
duration 6.122154 262.921464
---------------------------------------------
armed4$country: Yemen (North Yemen)
          high_est duration
high_est 971.07230 24.52792
duration 24.52792 10.70436
---------------------------------------------
Table 2: Partial snapshot of variance-covariance matrices for individual countries
As the test results suggest, the variances for High_est and Duration are similar for some countries (e.g., Egypt), in some cases the variances are different. So, for this dataset we can interpret that homogeneity of variance-covariance may not hold true for all the countries.
Now that we have tested all the assumptions, next we will proceed for MANOVA. Since the variances and covariances across groups are not exactly similar in our case, we will go for a robust MANOVA. We have performed both Choi and Marden’s robust test as well as Munzel and Brunner’s test, the results of which are compared in the table as shown in the below section:
| mulrank() | cmanova() |
    $test.stat
    [1] 1.322191

    $nu1
    [1] 4.439797

    $p.value
             [,1]
    [1,] 0.255643
    $N
    [1] 33

    $q.hat
              [,1]      [,2]
    [1,] 0.4531680 0.4669421
    [2,] 0.4132231 0.4669421
|
    $test.stat
    [1] 16.8481

    $df
    [1] 6

    $p.value
                [,1]
    [1,] 0.009858016
|
Table 3: Comparison between the output of mulrank() and cmanova() function
From the output of the mulrank() function, we can see that we have a test statistic for the countries ($test.stat) as well as the corresponding p-value ($p.value). We can conclude that there is no significant main effect of the countries on the aspects of the either duration of conflicts or number of casualties involved, F = 1.32, p = 0.26. Therefore, we fail to reject our null hypothesis from the outcomes of Munzel and Brunner’s method.
However, the output of cmanova() shows a different result, here judging by the test-statistic and p-value (p>0.05) we can say the difference in countries involved has significant effect on the duration of the conflict.
For this experiment, we will go with the outcomes of Munzel and Brunner’s method and assume that outcome of the MANOVA test was non-significant, so we will not run any post-HOC test. So, in conclusion we fail to reject our both null hypotheses H1 and H2.
Limitations
This research is not without limitations. One of the significant limitation of the dataset is that it does not contain data from Syria, the country which is seeing a prolonged civil war since March 2011. So findings of these study can significantly alter once the data from Syria is included in this study. Also from the research design perspective, a more practical approach would be to include other significant factors such as timing of the conflict (Year), the nature of surrounding area of the current conflict zone (up to a certain radius), etc. So, multiple analysis of co-variance (MANCOVA) would be a better experiment than MANOVA for this research design. Other than that, there is also need to see the change in nature of conflicts in terms of duration and casualties over time. So, a time series analysis will be a better alternative to extend this study, which the researcher expects to cover in future work. Reference
References
-
Brams, S. J. (1997). Fair division: A new approach to the Spratly Islands controversy. International Negotiation, 2(2), 303-329.
-
Brock, L. (1991). Peace through parks: the environment on the peace research agenda. Journal of Peace Research, 28(4), 407-423.
-
Brundtland, G., Khalid, M., Agnelli, S., Al-Athel, S., Chidzero, B., Fadika, L., & Singh, M. (1987). Our common future. World Commission on Environment and Development. Oxford: Oxford University Press.
-
Croicu, M., & Sundberg, R. (2015). UCDP Georeferenced Event Dataset Codebook Version 4.0. Journal of Peace Research, 50(4), 523-532.
-
Croicu, M., & Sundberg, R. (2016). UCDP GED Codebook version 5.0, Department of Peace and Conflict Research, Uppsala University
-
Gleditsch, N. P. (1998). Armed conflict and the environment: A critique of the literature. Journal of peace research, 35(3), 381-400.
-
Lonergan, S. (1997). Water resources and conflict: Examples from the Middle East. In Conflict and the Environment (pp. 375-384). Springer Netherlands.
-
Sundberg, R., & Melander, E. (2013). Introducing the UCDP georeferenced event dataset. Journal of Peace Research, 50(4), 523-532.
-
Wallensteen, P., & Sollenberg, M. (2001). Armed Conflict, 1989-2000. Journal of Peace Research, 38(5), 629-644.