Contributors
Prof. Greg Watson - New York University
Adjunct Professor Data Science, Center for Data Science
Senior Research Scientist at Oak Ridge National Laboratory
Xianzhi Cao - New York University
Master’s student - Center for Data Science
Caroline Roper - New York University
Master’s student - Center for Data Science
Introduction
This project aims to provide users with an interactive tool to better understand the pattern of global terrorism attacks.
Our project visualizes the Global Terrorism Database from various perspectives and allows the user to explore the data by customizing our visualizations to meet their needs. Terrorism is an increasing concern despite recent progress along other development goals. The Global Terrorism Database provides a rich resource of information about how terrorism has changed over time and differs by region or country. Our project seeks to make the insights from the data discoverable to all. This project is part of the United Nations’ ICT4SD (Information and Communications Technology for Sustainable Development) program in the OICT department.
Getting Started
On this page we present you a static version of how this tool looks like. However, in order to customize and interact with all the visualizations, it is recommended to use Jupyter Notebook with related packages installed.
Dependencies
- Python 3.3+
Mandatory dependencies
- Numpy
- Pandas
- Matplotlib
- Seaborn
- Scipy
- Basemap
- Folium
- Jupyter Notebook
- Ipywidgets
- Json
We have presented a detailed user manual for users lacking the above dependencies.
Dataset
The dataset used for this study is Global Terroriam Database (GTD). The Global Terrorism Database (GTD) is an open-source database including information on terrorist events around the world from 1970 through 2015 (with annual updates planned for the future).
- Contains information on over 150,000 terrorist attacks
- Includes information on more than 75,000 bombings, 17,000 assassinations, and 9,000 kidnappings since 1970
- Includes information on at least 45 variables for each case, with more recent incidents including information on more than 120 variables
- Over 4,000,000 news articles and 25,000 news sources were reviewed to collect incident data from 1998 to 2015 alone
National Consortium for the Study of Terrorism and Responses to Terrorism (START). (2016). Global Terrorism Database. Retrieved from https://www.start.umd.edu/gtd
The GTD was designed to gather a wide variety of etiological and situational variables pertaining to each terrorist incident. Depending on availability of information, the database records up to 120 separate attributes of each incident, including approximately 75 coded variables that can be used for statistical analysis. These are collected under eight broad categories, as identified in the GTD Codebook, and include, whenever possible:
1) GTD ID and Date:
- Eventid: Incidents from the GTD follow a 12‐digit Event ID system.
- Year, Month, Day, Approximate Date
- Extended Incident: whether the duration of an incident extended more than 24 hours or not.
2) Incident Information:
- Incident Summary: A brief narrative summary of the incident, noting the “when, where, who, what, how, and why.”
- Inclusion Criteria
3) Incident Location:
- Country, region, state/province, city, vicinity, Location Description.
- Latitude and longitude
- Geocoding specificity
4) Attack Information:
- Attack Type: 8 categories + unknown.
- Assassination, Hijacking, Kidnapping, Barricade Incident, Bombing/Explosion, Armed Assault, Unarmed Assault, Facility/Infrastructure Attack, and Unknown.
- Suicide Attack
5) Weapon Information:
- Weapon Type: 12 categories + unknown.
- Several sub weapon types.
6) Target Information:
- Target Type: 22 categories
- Several specific target/victim information, including names, nationalities, etc.
7) Perpetrator Information:
- Perpetrator Group Name: the name of the group that carried out the attack
- Several sub-group information, including number, claim, motive, etc.
8) Casualties and Consequences:
- Total Number of Fatalities, including Number of US Fatalities and Number of Perpetrator Fatalities
- Total Number of Injured, including Number of U.S. Injured and Number of Perpetrators Injured
- Property Damage, including damage extend, values and comments
- Total Number of Hostages/Kidnapping Victims, including US Hostages or Kidnapping Victims, kidnapping hours, countries, total ransom mmount demanded, and number released/escaped/rescued
9) Additional Information and Sources:
- Additional relevant details about the attack, including International‐ Logistical, International‐ Miscellaneous, and sources.
Analysis
To begin with our data analysis journey, we will start with the time series statistical overview from 1970 to 2015, by customising the country (or the whole world) and the feature selection. Above is an example of the terrorism attack occurrence trend overview within the whole world. A upward going trend can be observed straightforwardly, with a peak in the year 2014. Table 1 is a detailed statistical analysis.
Table 1: World Terrorism Attack Overview
| World Overview (1970 - 2015) | |
|---|---|
| Year with Most Attacks and Casualties | 2014 |
| Total Number of Terror Attacks in 2014 | 16840 |
| Total Number of Casualties in 2014 | 84089 |
For this specific area selected (in this case, the whole world), the Occurrences of Terrorism Attacks analysis is shown in Table 2.
Table 2: Occurrence Analysis for the Chosen Area: Worldwide
| Features | Occurrences |
|---|---|
| Total Number | 156772 |
| Annual Average | 3483 |
| 1 Unit STD | 3441.55 |
Also, if we select “Casualties” as the target feature, we can get a detailed statistical analysis on the total, annual and variational status of the global terrorism attacks. Table 3 shows a statistical analysis of Casualties around the whole world during 1970 to 2015.
Table 3 Casualties Analysis: Worldwide (1970-2015)
| Features | Casualties | |
| Total | Fatalities | 348215 |
| Wounds | 440002 | |
| Annual | Fatalities | 7738 |
| Wounds | 9777 | |
| 1-unit STD | Fatalities | 8447.86 |
| Wounds | 10357.73 |
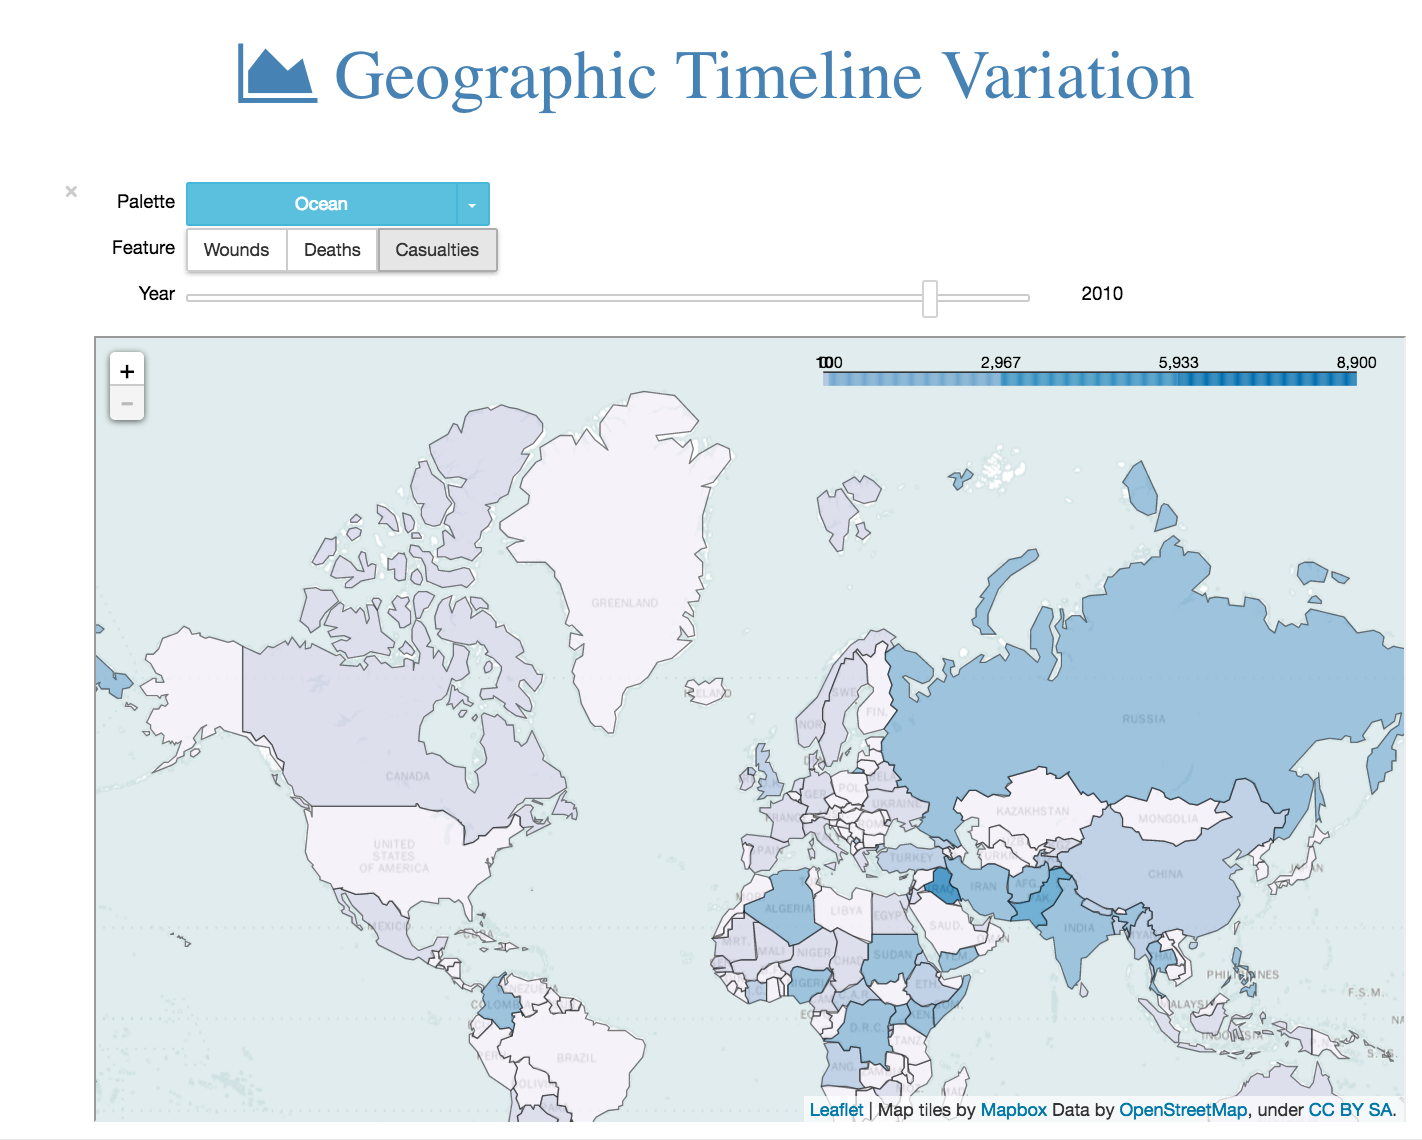
In order to extract the information on the severity level of terrorism attack within certain selected year or time period, the Choropleth map above is the ideal visualization tool to realize it.
A darker color indicate a higher casualty (fatality or wound) level within certain regions or countries. For instance, in the year 2010, Southeast Asia (especially Iraq) has been suffering severe terrorism attacking threats compared with the rest of the world; some countries in East Europe, Africa and South America, i.e. Russia, Columbia and so on, were also exposed to high terrorism attacks casualties.
Regions that were relatively safe during the year 2010 were: North America, West Europe, Oceania and the majority part of South America.
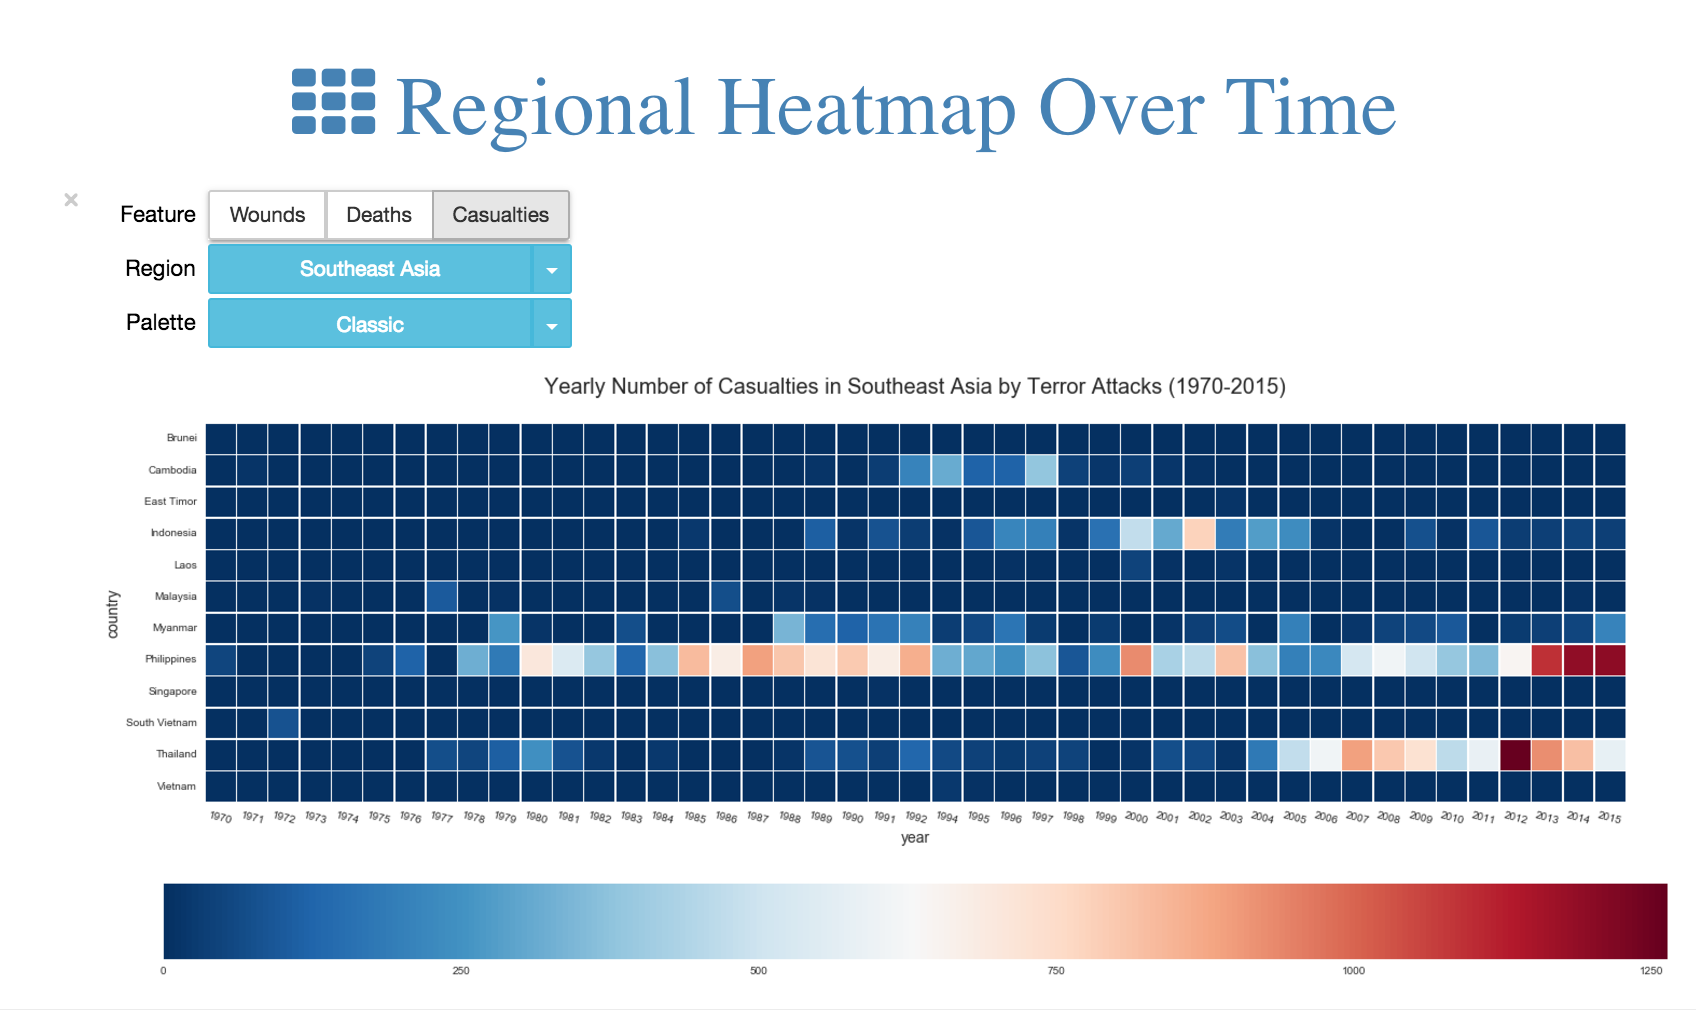
For this project, we also present the heatmap to identify:
- Horizontal: The casualty significance over timeline (1970-2015) based on countrywide terrorism attacks within region divisions
- Vertical: The regional comparisons and relations about the number of casualties among the countries within region divisions
For this research design, the countrywide variations and severities are both shown as our outcome. Specifically, in Southeaset Asia, Philippines has been the most dangerous country in terms of terrorism attacks. Moreover, it is also observable that there has been a surging terrorism attack impact trend in Thailand, peaking in the year 2012. The rest of the countries are relatively safe within this region.
In order to analysis the influences caused by the terrorism attackes, we examine the dependent relations between the occurrences and casualties for each country, taking 5 years as our analytical stage length. The Bubble Chart above presents an ideal visualization for this aim.
The larger the size of the bubble, the more total terrorism attacks has taken in the place. By slding the year selection tool on the top, users can view all the countryside terrorsim attack variations.
For instance, during the year 1990 to 1995, Columbia, Turkey and Peru were the top three countries suffering the most frequent terrorism attacks, however, while these three countries’ casualties were quite high, they were not in the top three countries suffering the most fatalities and wounds.
While the total number of the terrorism attacks overall in Japan was much lower than the world average, Japan ranked top one during this time stage, with casualty numbers close to 7000, followed by India and Sri Lanka, over 6000 and 5000, respectively.
Apparently, the damage level is generally positively related to the terrorism attack frequencies, however, in certain countries (Japan in this instance), the attack influences are much more significant.
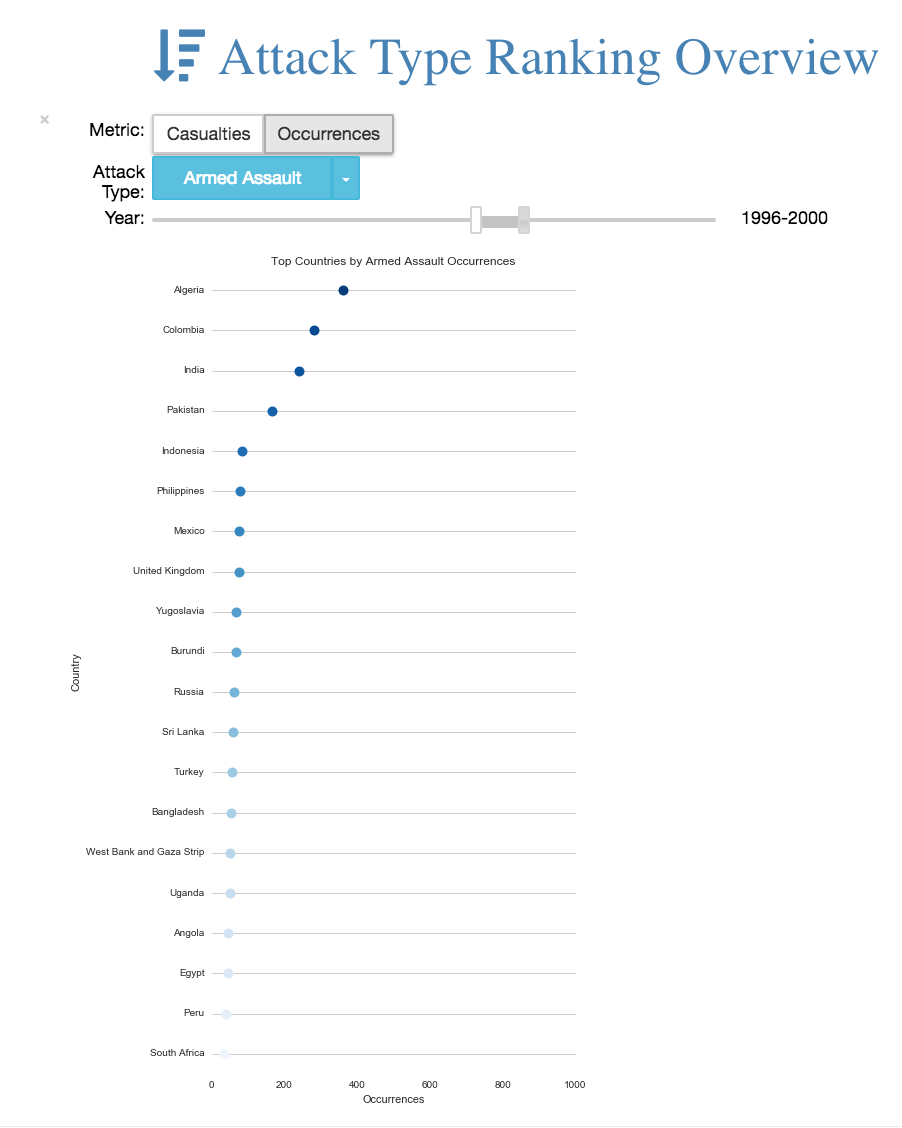
In our final analysis, we classified the terrorism attack types into different categories. The above Dot Plot shows the “top 20” countries who rank the highest for the chosen attack type and the chosen years. By selecting the metric, either casualties or occurrences (Casualties includes killed or wounded, and occurrences refers to terrorism events.), attack type, and time interval, the countries will be ranked.
For instance, during the year interval 1996 to 2000, Algeria suffered the most from the Armed Assault, followed by Columbia, India and Pakistan.
References
-
National Consortium for the Study of Terrorism and Responses to Terrorism (START). (2016). Global Terrorism Database. Retrieved from https://www.start.umd.edu/gtd
-
Croicu, M., & Sundberg, R. (2016). UCDP GED Codebook version 5.0, Department of Peace and Conflict Research, Uppsala University
-
Sundberg, R., & Melander, E. (2013). Introducing the UCDP georeferenced event dataset. Journal of Peace Research, 50(4), 523-532.


